Overview
Kpow's Data inspect function allows you to quickly and easily search and filter records from multiple topics in a single query.
- Just enter multiple topics in the Topic selector.
- The interface will fetch and decode messages from all specified topics.
- You can combine this with kJQ filters to apply conditions across multiple streams.
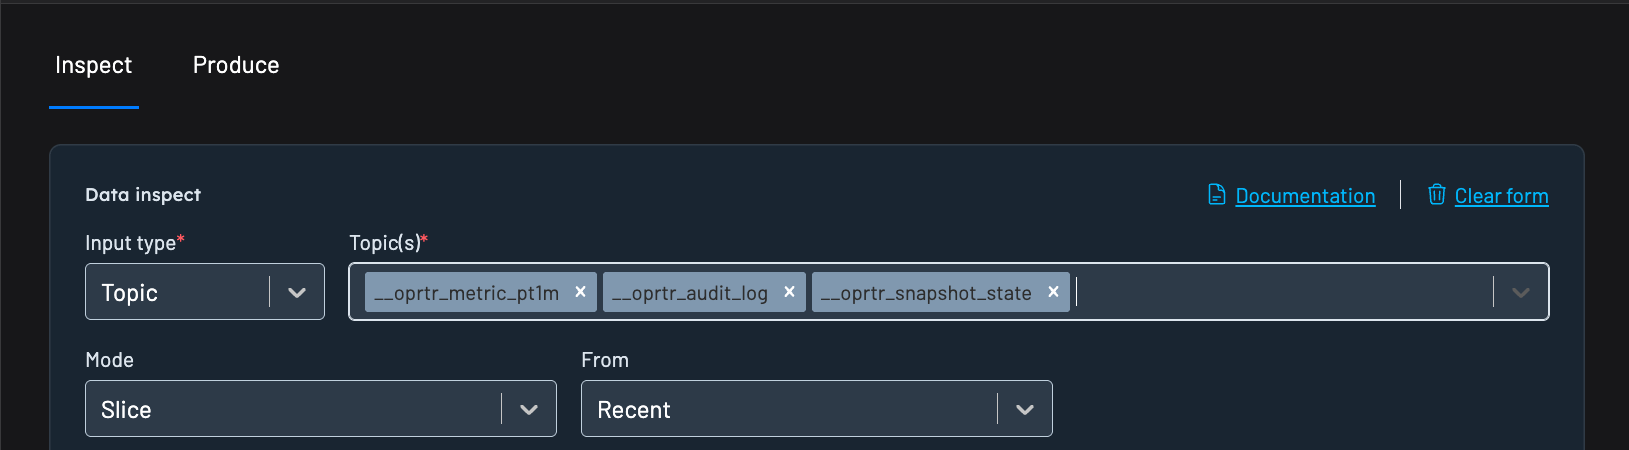
All topics must be configured with compatible SerDes (e.g., AVRO for value deserializer) for consistent filtering.
Records can then be easily updated and re-produced back to Kafka topics via Kpow's Data Produce function, or individual records can be cloned into your choice of topic to avoid unwanted modifications.
Usage
Input type
Data inspect has three different input types that identify which topics to search:
- Topic: search records in 1-n topics identified by topic names
- Topic Regex: search records in topics where the topics name matches a topic regex
- Group: search records in topics that are currently being consumed by a group
Mode
Data inspect has four different modes when searching topics:
- Slice: search records from one or more topics starting from a point in time
- Bounded window: search records from one or more topics with a query start and end time
- Partition: search records within a single topic partition and from an (optional) offset
- Key: search records from one or more topics, starting from a point in time and matching an exact key
Slice, Partition, or Key queries
When using Slice, Partition, or Key mode, Kpow will search records from a starting point in time, continuing until all topic partitions are exhausted or 100 results have been returned.
You may choose to manually 'continue' a query, reading further records beyond the 100 results or newly produced to the topic.
The 'From' field defines when the query starts:
- Recent: query the most recent 100 records, evenly distributed among all topics partitions.
- Last minute: query records produced in the last minute
- Last 15 minutes: query records produced in the last 15 minutes
- Last hour: query records produced in the last hour
- Last 24 hours: query records produced in the last 24 hours
- From earliest: query from the earliest record in each partition
- From timestamp: query records produced since a specific timestamp
- From datetime: query records produced since a specific local datetime
Bounded window queries
When using Bounded window mode, Kpow will search records between a start and end time, continuing until all topic partitions are exhausted or 100 results have been returned.
You may chose to manually 'continue' a query, reading further records beyond the 100 results, but once a query has reached the end it is not possible to continue further.
The 'Window start' field defines when the bounded window starts:
- Earliest: query from the earliest record in each partition
- From timestamp: query records produced since a specific timestamp
- From datetime: query records produced since a specific local datetime
- From duration ago: query records produced in the ISO8601#duration (e.g P1DT2H30M means the most recent 1 Day, 2 hours, and 30 minutes)
The 'Window end' field defines where the bounded window ends:
- Now: query until the current time
- To timestamp: query records produced until a specific timestamp
- To datetime: query records produced until a specific local datetime
- To duration from window start: query records produced until the ISO8601#duration from window start (e.g. PT15M is means a 15 minute window)
Bounded window durations
Kpow accepts ISO8601#duration format for all duration input, for example:
PT15Mis fifteen minutesPT3H15Mis three hours and fifteen minutesP2DT3H15Mis two days, three hours, and fifteen minutesP2Wis two weeksP1Mis one monthP3Y6M4DT12H30M5Sis three years, six months, four days, twelve hours, thirty minutes, and five seconds
SerDes
By default, the TOPIC_INSPECT access policy is disabled. To view the contents of messages in the data inspect UI, see the configuration section of this document.
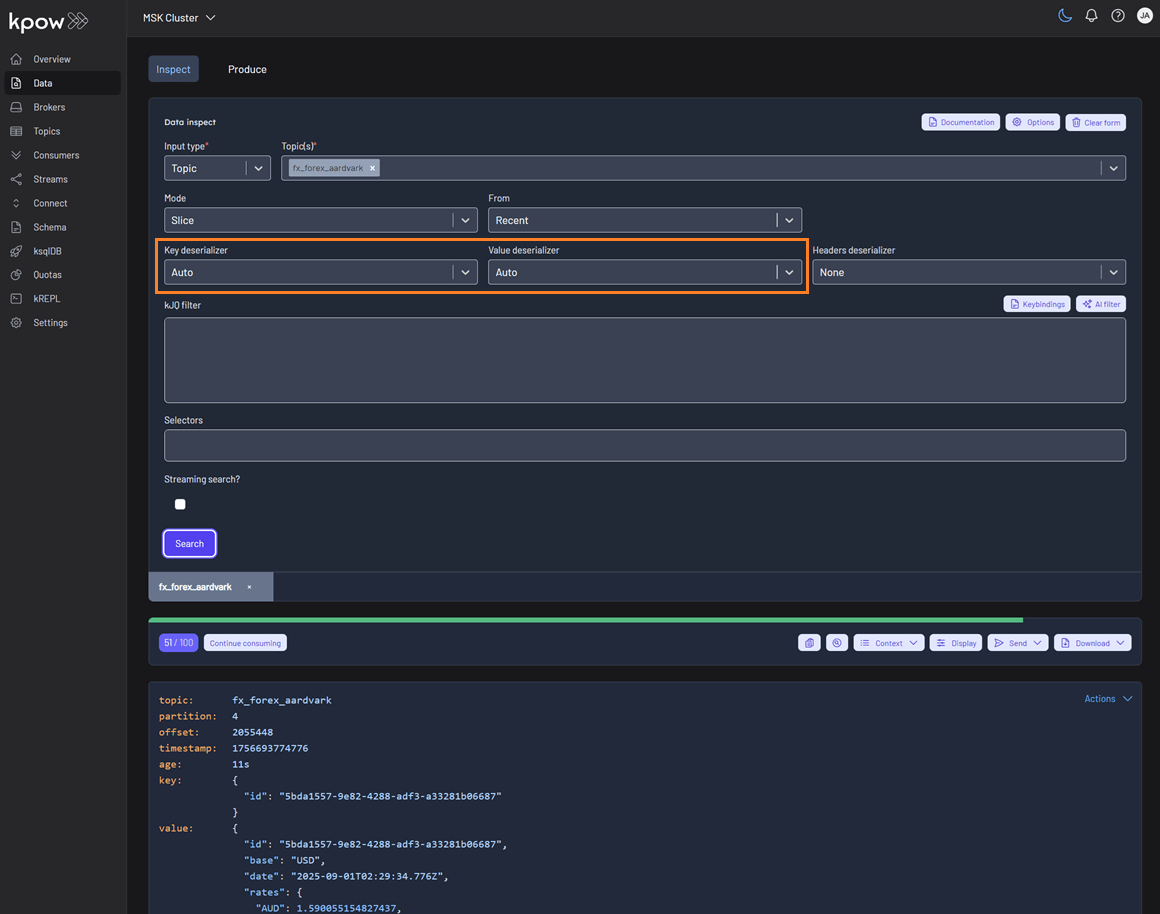
Within Kpow's Data Inspect UI, you can specify Auto as the key or value deserializer and Kpow will attempt to infer the data format and deserialize the records it consumes.
Auto SerDes provides immediate data inspection capabilities without requiring prior knowledge of topic serialization formats. This feature is particularly valuable when:
- Exploring unfamiliar topics for the first time
- Working with multiple topics that may contain mixed data formats
- Debugging serialization issues across different environments
- Onboarding new team members who need quick topic insights
The Auto SerDes option appears alongside manually configurable deserializers like JSON, Avro, String, and custom SerDes in the Data Inspect interface.
When selected, Kpow analyzes each topic and applies the most appropriate deserializer automatically.
If you want to specify a particular serializer or deserializer, see the SerDes section for more details on using Data Inspect SerDes.
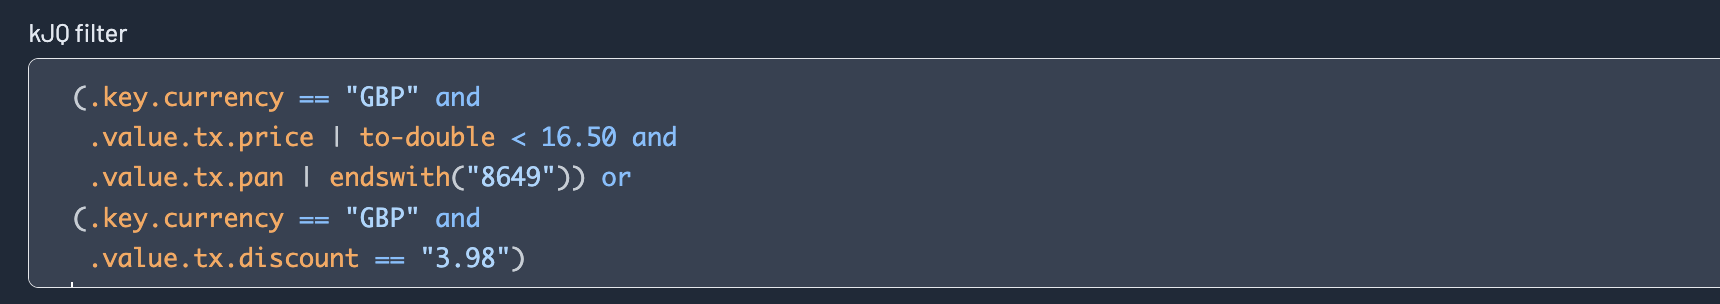
Filtering
Kpow offers very fast JQ-like filters for search data on topics. These filters are compiled and executed on the server, allowing you to search tens of thousands of messages a second.
See the kJQ filters section for documentation on the query language.
Projection expressions
Projection expressions let you extract specific fields from a record using a comma-separated list of kJQ expressions.
Learn more in the Projection expressions tutorial.
Headers
Select a Headers Deserializer in the Data inspect form to include Message Headers in your results.
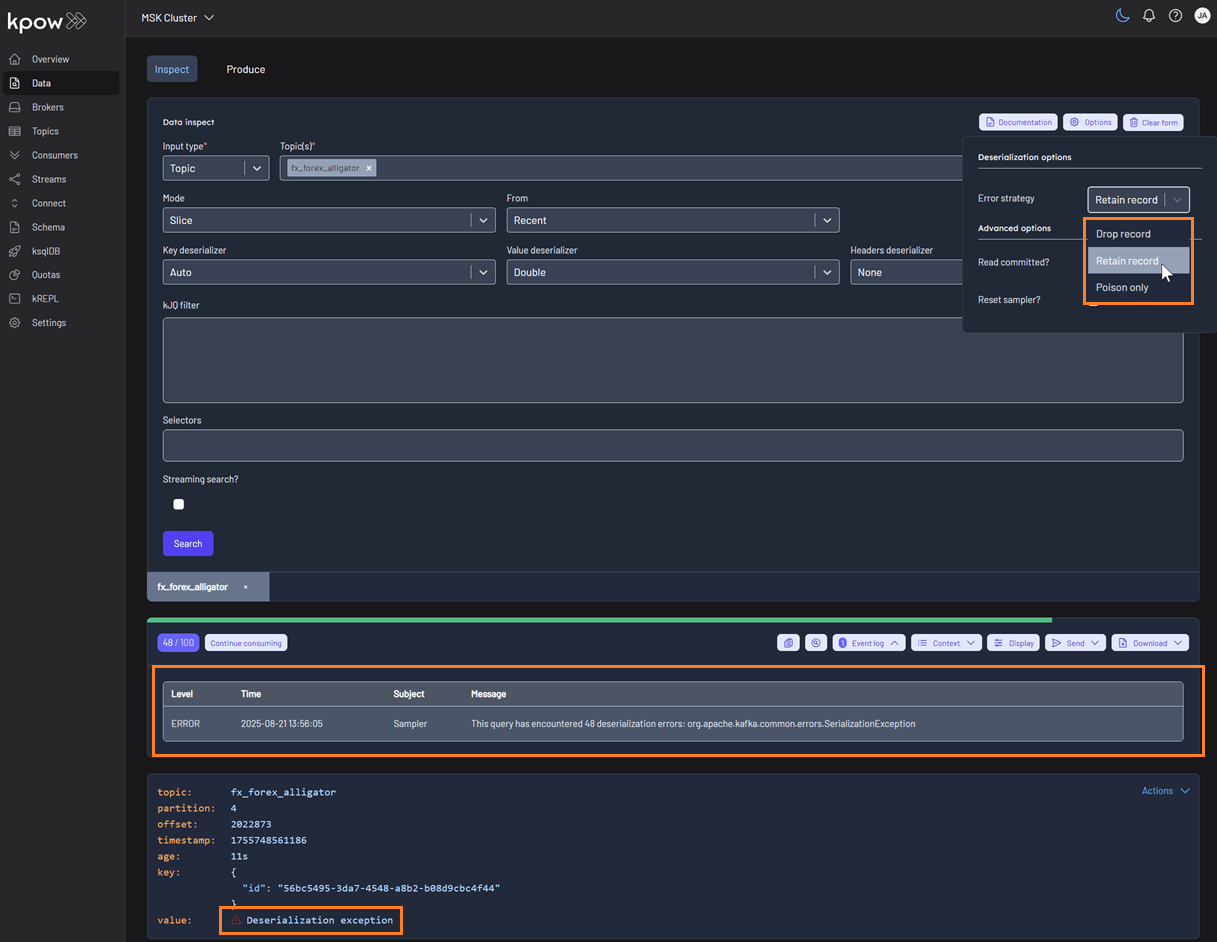
Deserialization options
Kpow helps you inspect data more effectively by surfacing detailed schema metadata for each message, including schema IDs and deserializer types. It also highlights schema mismatches and poison messages. To control how these are handled, you can choose from the following deserialization options:
- Drop record (default): Ignores erroneous records and displays only well-formatted records.
- Retain record: Includes both well-formatted and erroneous records. Instead of displaying the raw, poisonous value for problematic records, the system flags them with the message 'Deserialization exception'.
- Poison only: Displays only erroneous records, where the value is recorded as 'Deserialization exception'.
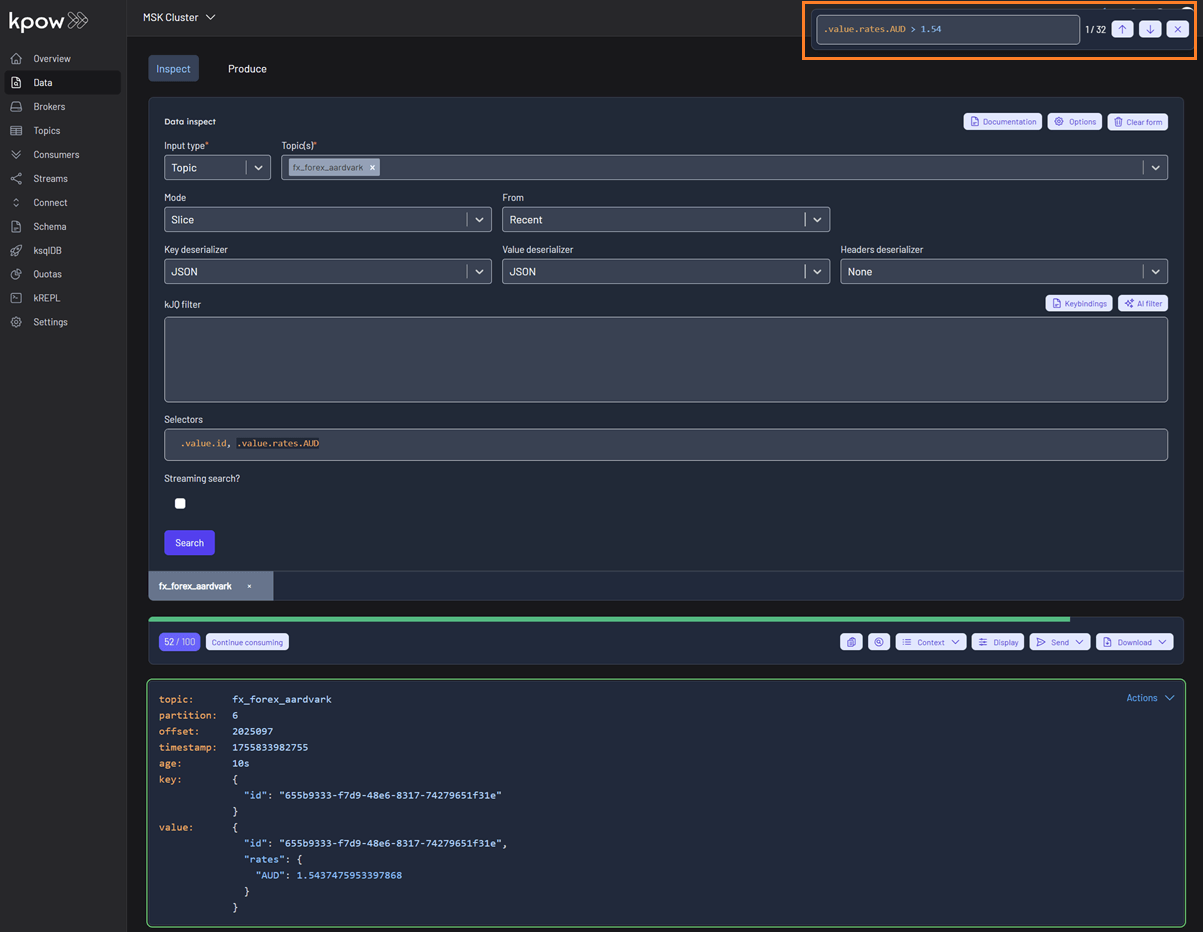
In-browser search
Kpow supports in-browser search (CMD/CTRL + SHIFT + F) with kJQ filters to quickly find records by JSON path or value without re-running queries. The results component is now fully keyboard-friendly and follows the Listbox pattern, making it easier for everyone to navigate. Screen reader users can understand the list structure, and keyboard users can move through and select items smoothly and predictably.
Query results
Results toolbar

Query progress
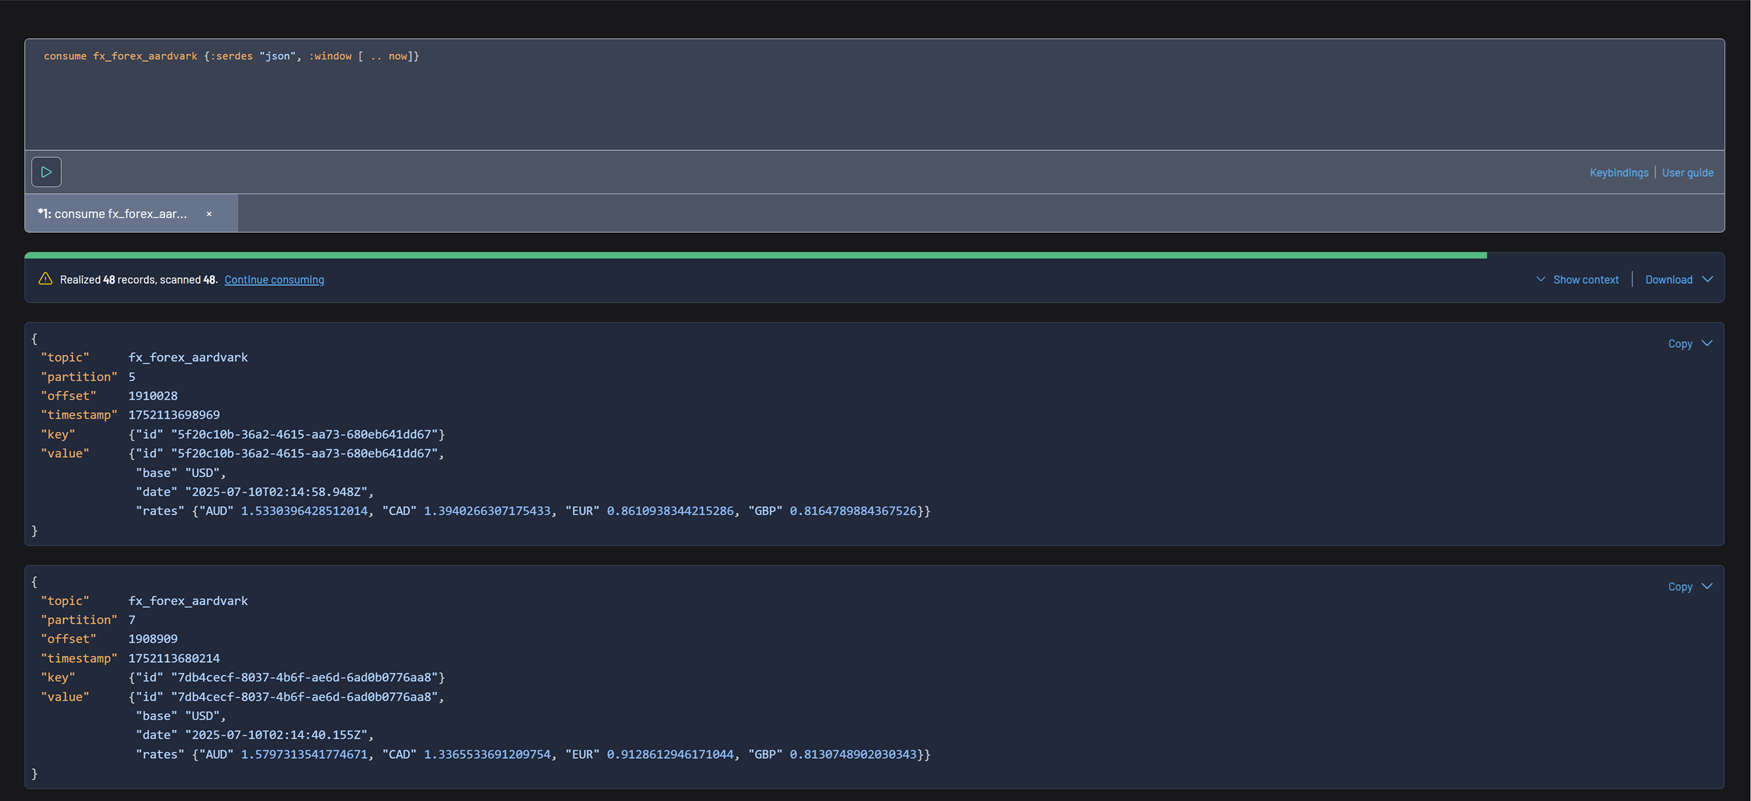
Data inspect queries have a start and end cursor position. The start is defined by the window of the query, and the end position is the time in which the query was first executed. Once a query has been executed, the query metadata has the notion of "progress": how many records you have scanned, and how many records remain for the query. The green progress bar above the toolbar represents the total progress of the query. You can always click "Continue consuming" to keep progressing your cursor.
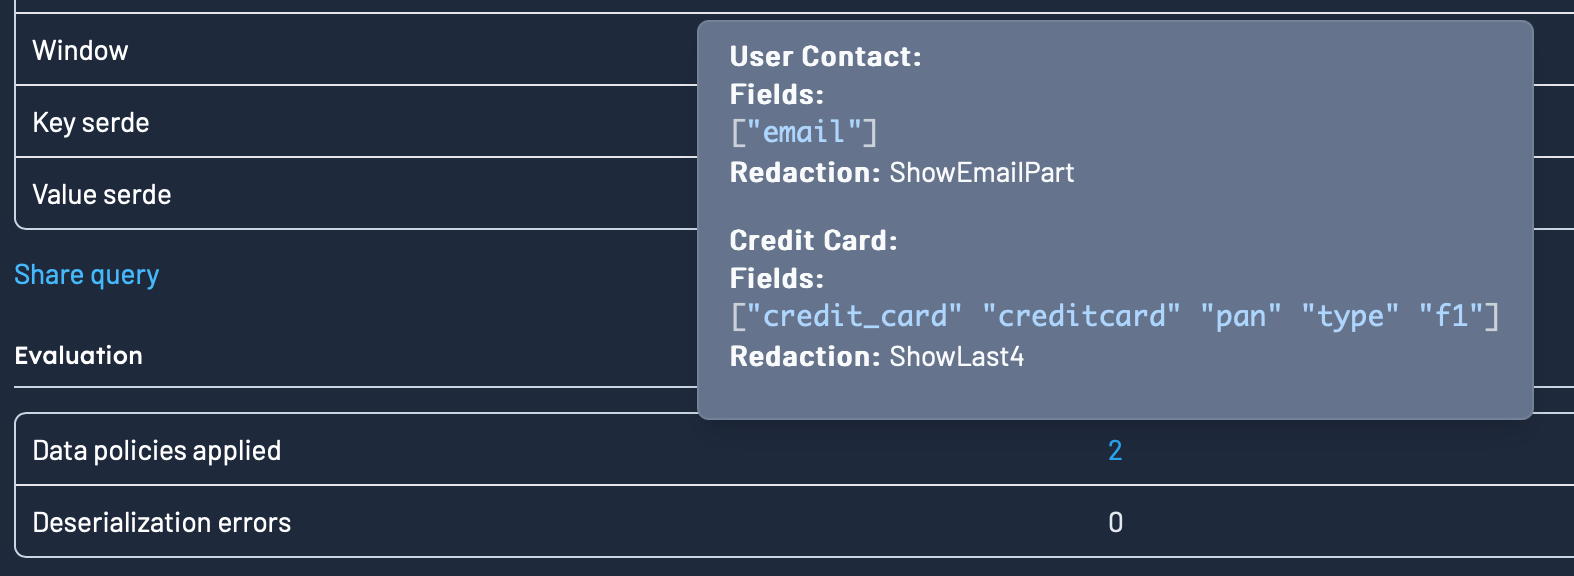
Data policies
If you have any Data Policies that apply to the query that was executed, the Context section will show you what policies matches your queries, and the redactions applied.
Results metadata table
Clicking the "Context" button in the results toolbar will expand the Result Metadata Table, which is a table of your queries cursors across all partitions.
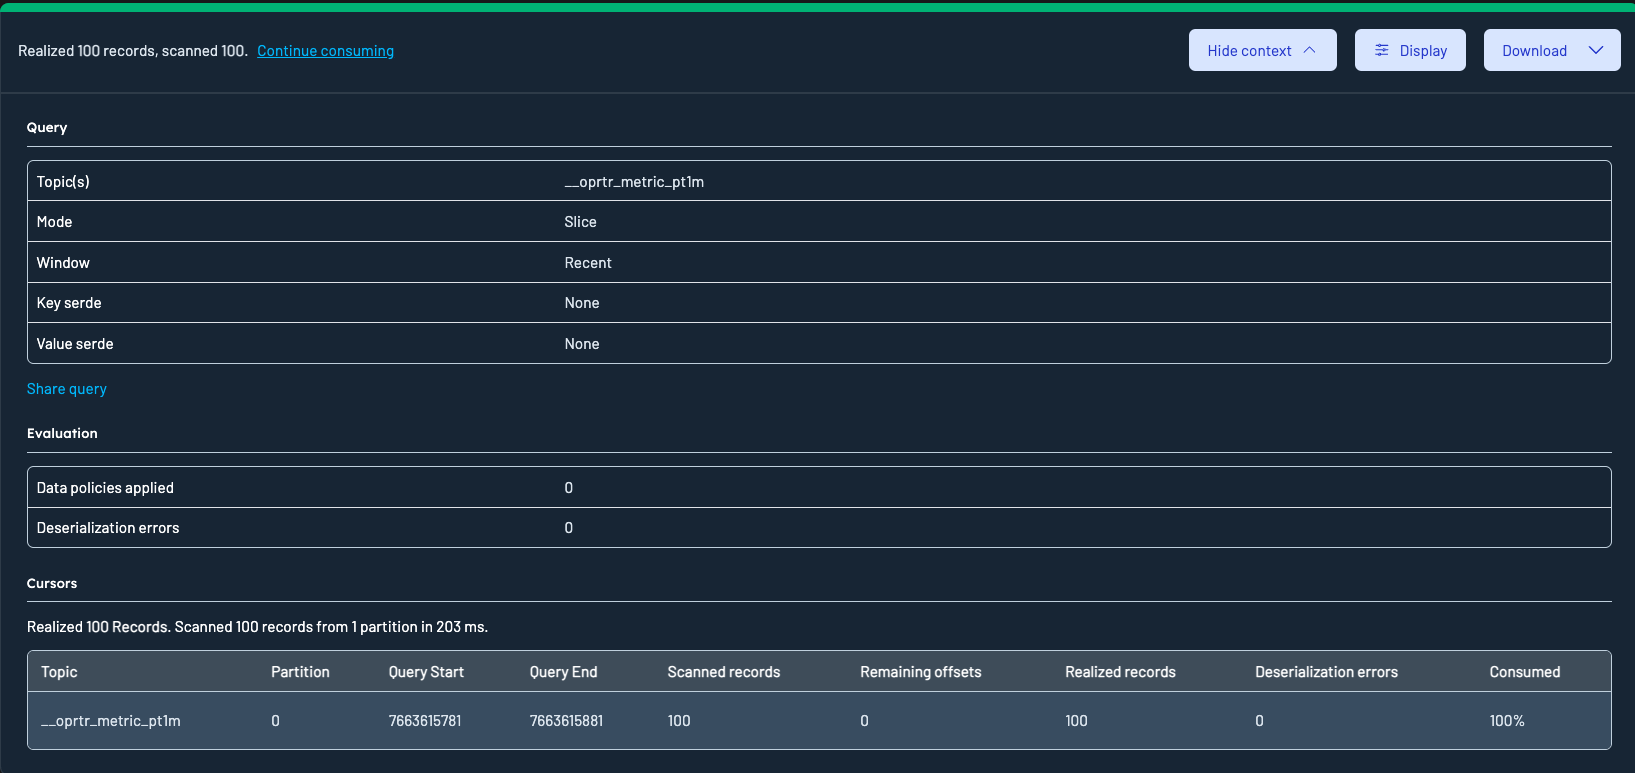
Results metadata table explanation
- Topic: The Kafka topic from which the data was queried
- Partition: the partition the row relates to
- Query start: the offset that data inspect started scanning from for this partition. Calculated from the query window.
- Query end: the offset that data inspect will scan up to. Calculated from the query window.
- Scanned Records: the number of records in this partition that have positively matched the key or value filters specified in the query
- Remaining Offsets: Offsets still available beyond the query window.
- Realized Records: Records returned after filters were applied.
- Deserialization Errors: Records that failed to deserialize due to schema or format issues. Excluded from Realized records.
- Consumed: the percentage of overall records consumed for this partition.
Results display options
Kpow's Display panel allows you to tailor how Kafka records are presented during inspection. This panel is accessible from the Results Toolbar by clicking the "Display" button.

Note: All Display Options are automatically persisted to localStorage. This means your preferences (ordering, formatting, visibility, etc.) will remain consistent across browser sessions.
Ordering
You can now choose how records are sorted:
- By Timestamp (ascending or descending)
- By Offset (ascending or descending)

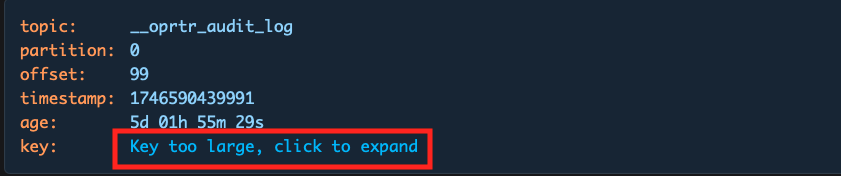
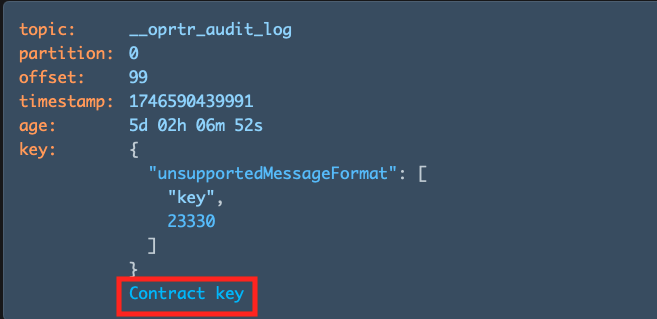
Collapse data threshold
Use the Collapse data over input to set a maximum byte threshold for displaying record content. If either the key or value of a record exceeds this threshold, the content will be collapsed and shown with a toggle:
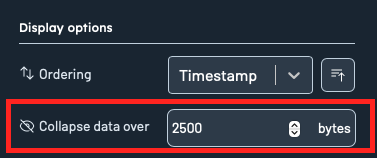
Users can manually expand or contract the content using the toggle provided.
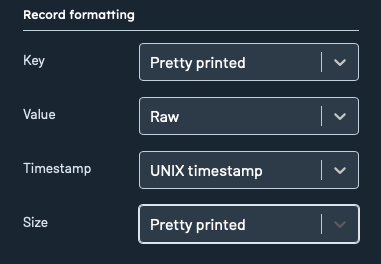
Record formatting
Each record attribute can now be customized in terms of its display style:
- Key/Value
Pretty printed: Formats the key/value for readability while preserving original field order.Pretty printed (sorted): Formats the/value key and sorts fields alphabetically for easy comparison.Raw: Displays the key's original, unprocessed data without any formatting.
- Timestamp:
UNIX timestamp,UTC datetime, orLocal datetime - Size:
Pretty printedorInt(raw byte count)
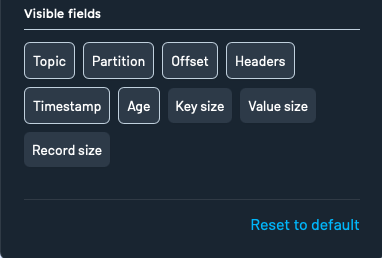
Visible fields
Toggle visibility for metadata fields like:
- Topic
- Partition
- Offset
- Headers
- Timestamp
- Age
- Key size
- Value size
- Record size
Click Reset to default to restore the original display preferences.
Results sending to kREPL
Kpow supports an option to select query results to kREPL, which is a notebook-style IDE for exploring and controlling Apache Kafka®.

Klang is a language designed for navigating the time series. Klang syntax is a blend of JQ and Clojure, and you can use either language or both. See the accompanying user guide for more information.
Results downloading options
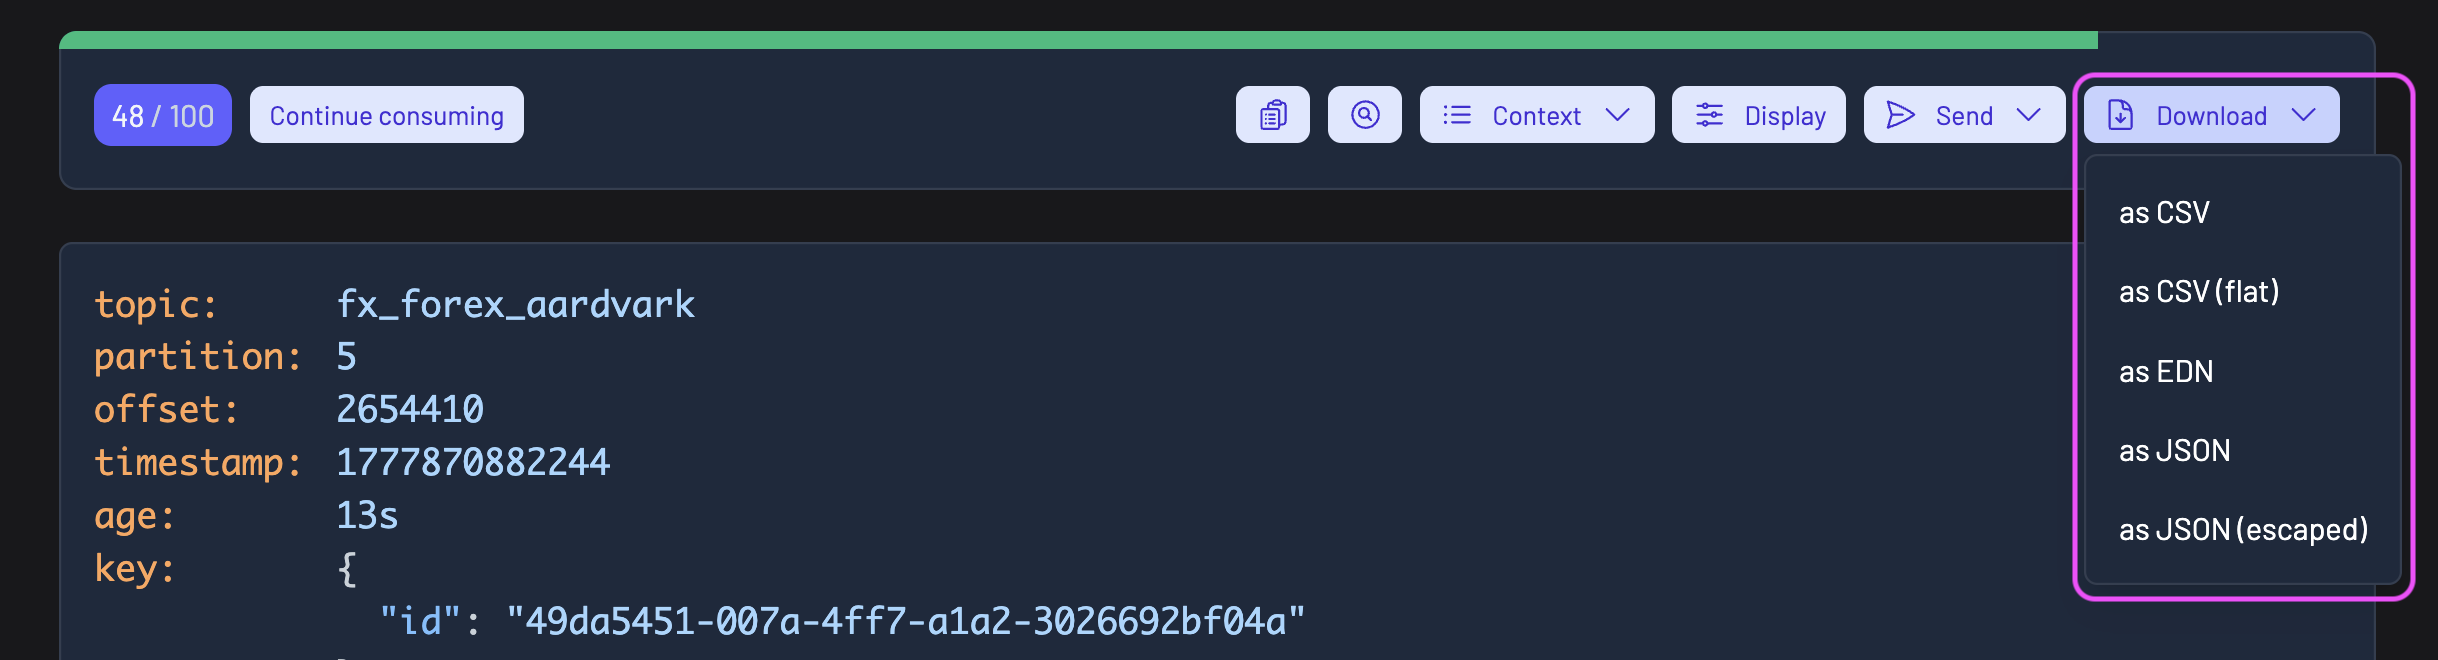
You can download records using the Download button in the top-right of the Inspect UI.
Available formats include:
- CSV
- CSV(flat)
- EDN
- JSON
- JSON (escaped)
Note: The current Display Options (e.g. raw vs pretty printed, visible fields) directly impact how records are presented in the download output. For example:
- If
Rawis selected for keys or values, the downloaded data will reflect the unformatted structure.- If certain metadata fields (like headers or sizes) are toggled off, they may be excluded from the downloaded dataset.
To ensure the export format matches your expectations, review and adjust your Display settings prior to downloading.
CSV (Flat) format
The CSV (Flat) format flattens the structure of Kafka records to include all nested fields inline with dot notation.
For example, given a Kafka message like:
{
  "id": "abc-001",
  "invoice": {
    "date": "2024-10-04T00:00:00Z",
    "amount": 123.45
  }
}
The CSV (Flat) export will produce headers like:
value.id,value.invoice.date,value.invoice.amount
And corresponding rows:
abc-001,2024-10-04T00:00:00Z,123.45
This is useful for:
-
Flattening complex record structures into tabular form
-
Easily opening records in spreadsheet tools like Excel or Google Sheets
-
Ensuring compatibility with downstream tools expecting flat CSV data
Use Display Options to toggle visible fields and formatting preferences before exporting. These impact the structure and content of the exported dataset.
Produce
The entire result set can be sent to Data Produce via the Send > Data produce menu item. An individual record can be sent via the Actions > Produce menu item. See Data Produce for details.
Clone to topic
Clone to topic must be enabled either via Simple Access Control or Role Based Access Control.
Ideal for Dead Letter Queue (DLQ) management, the entire result set can be cloned via the Send > Clone to topic menu item in the results toolbar. This requires enabling Bulk actions.
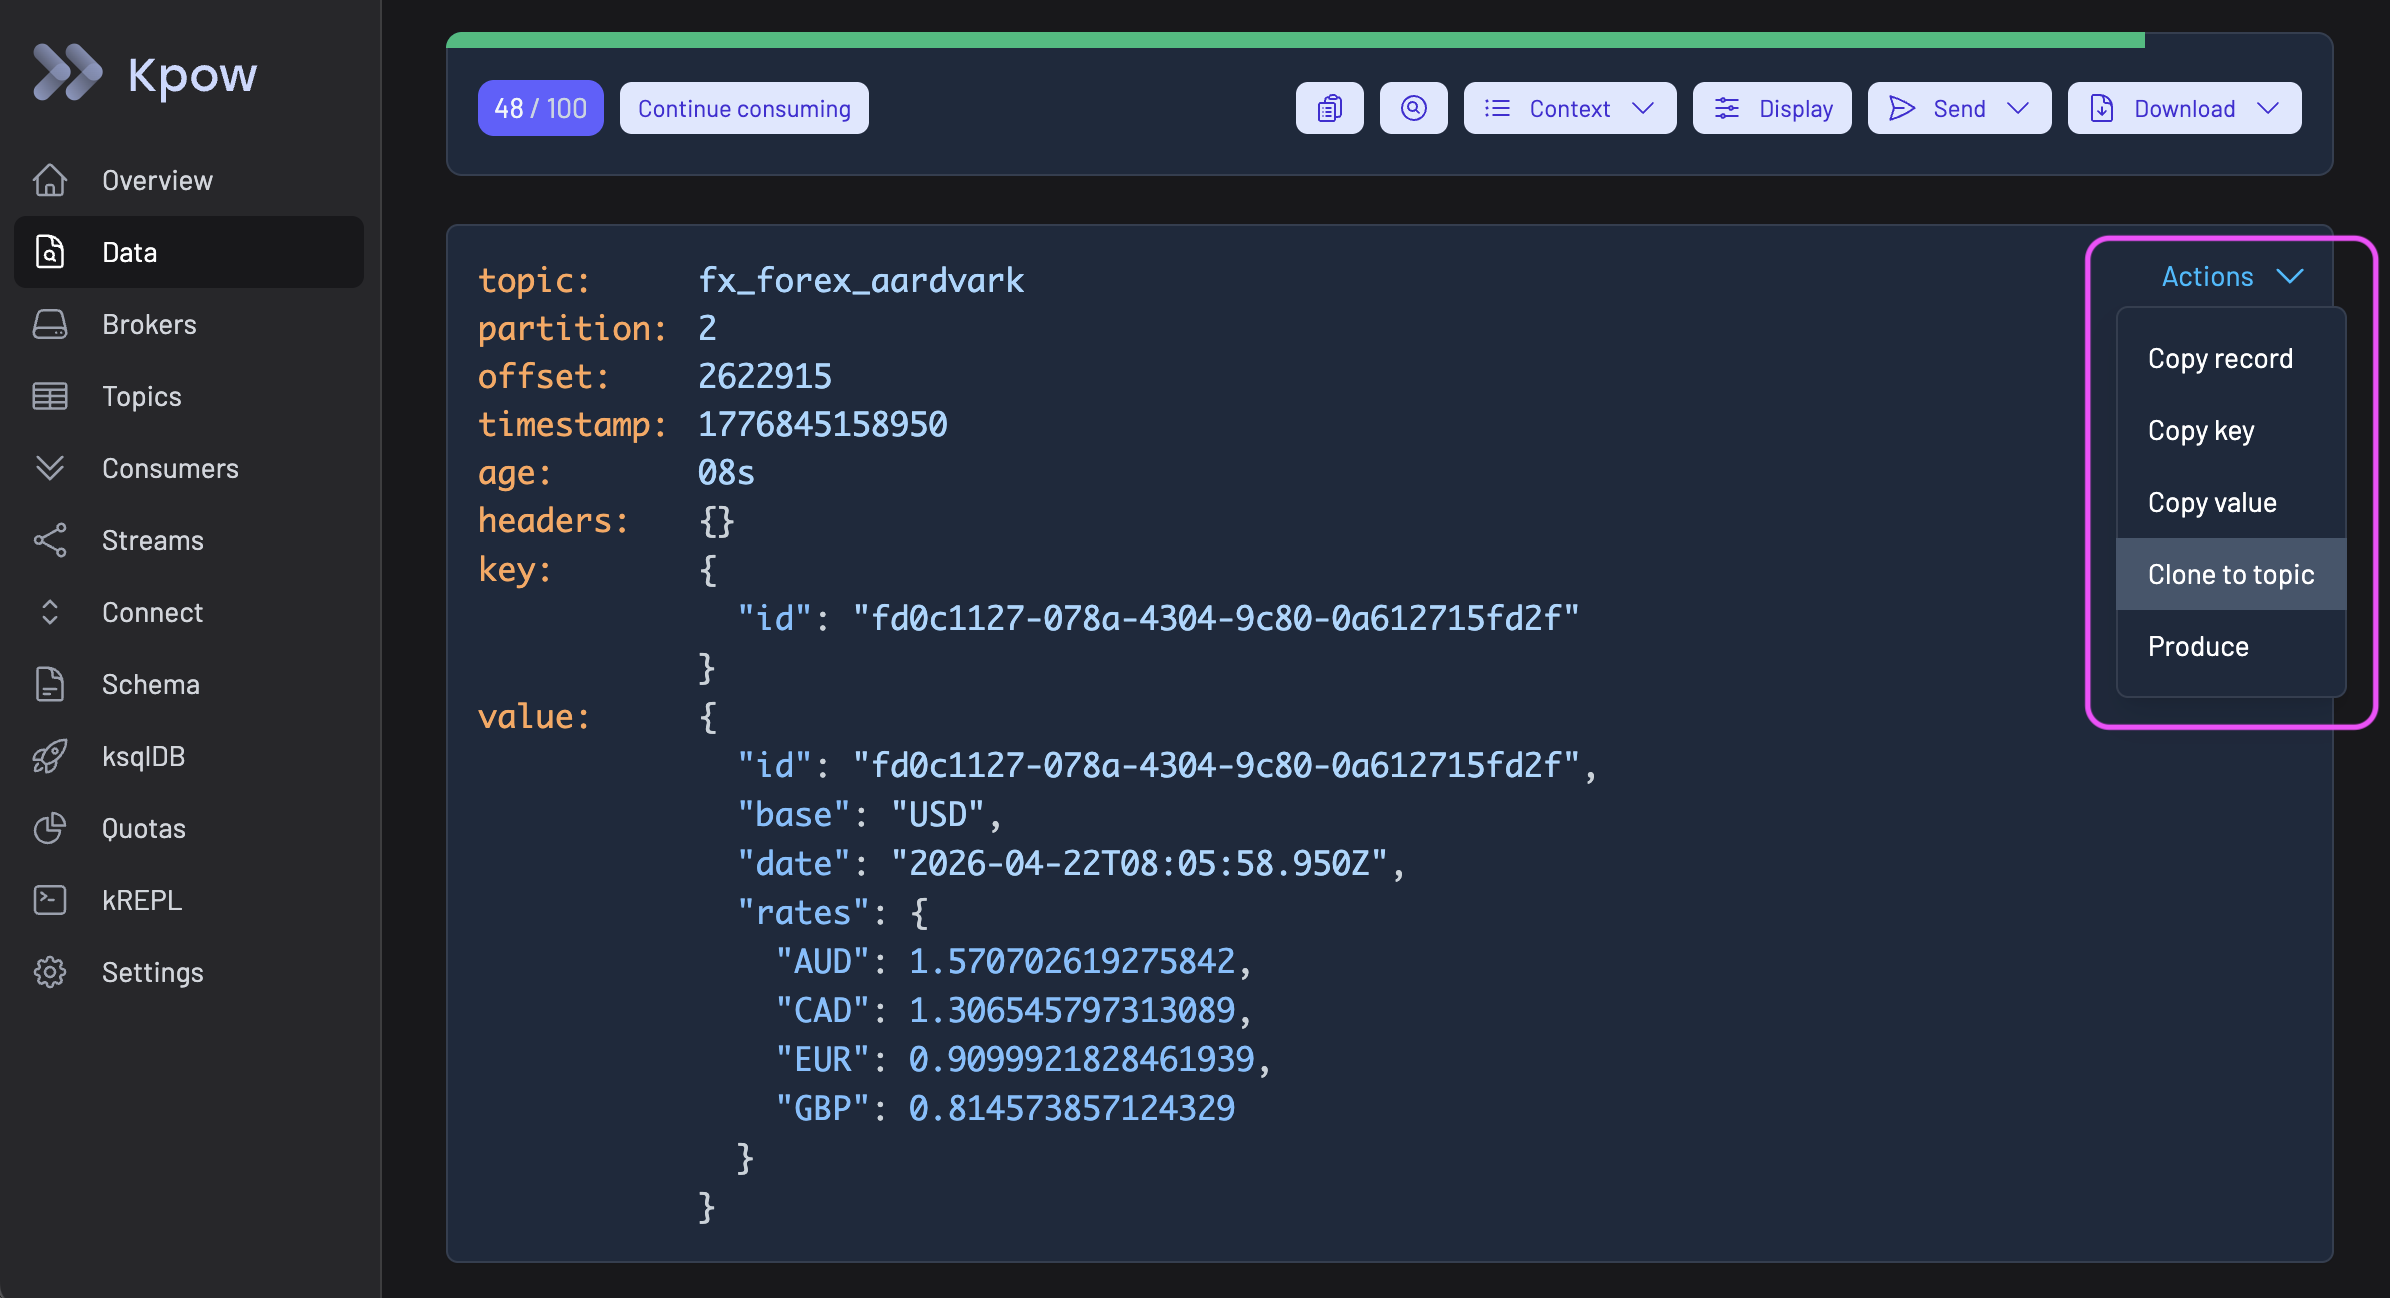
Individual records can be cloned by selecting the Actions > Clone to topic menu item:
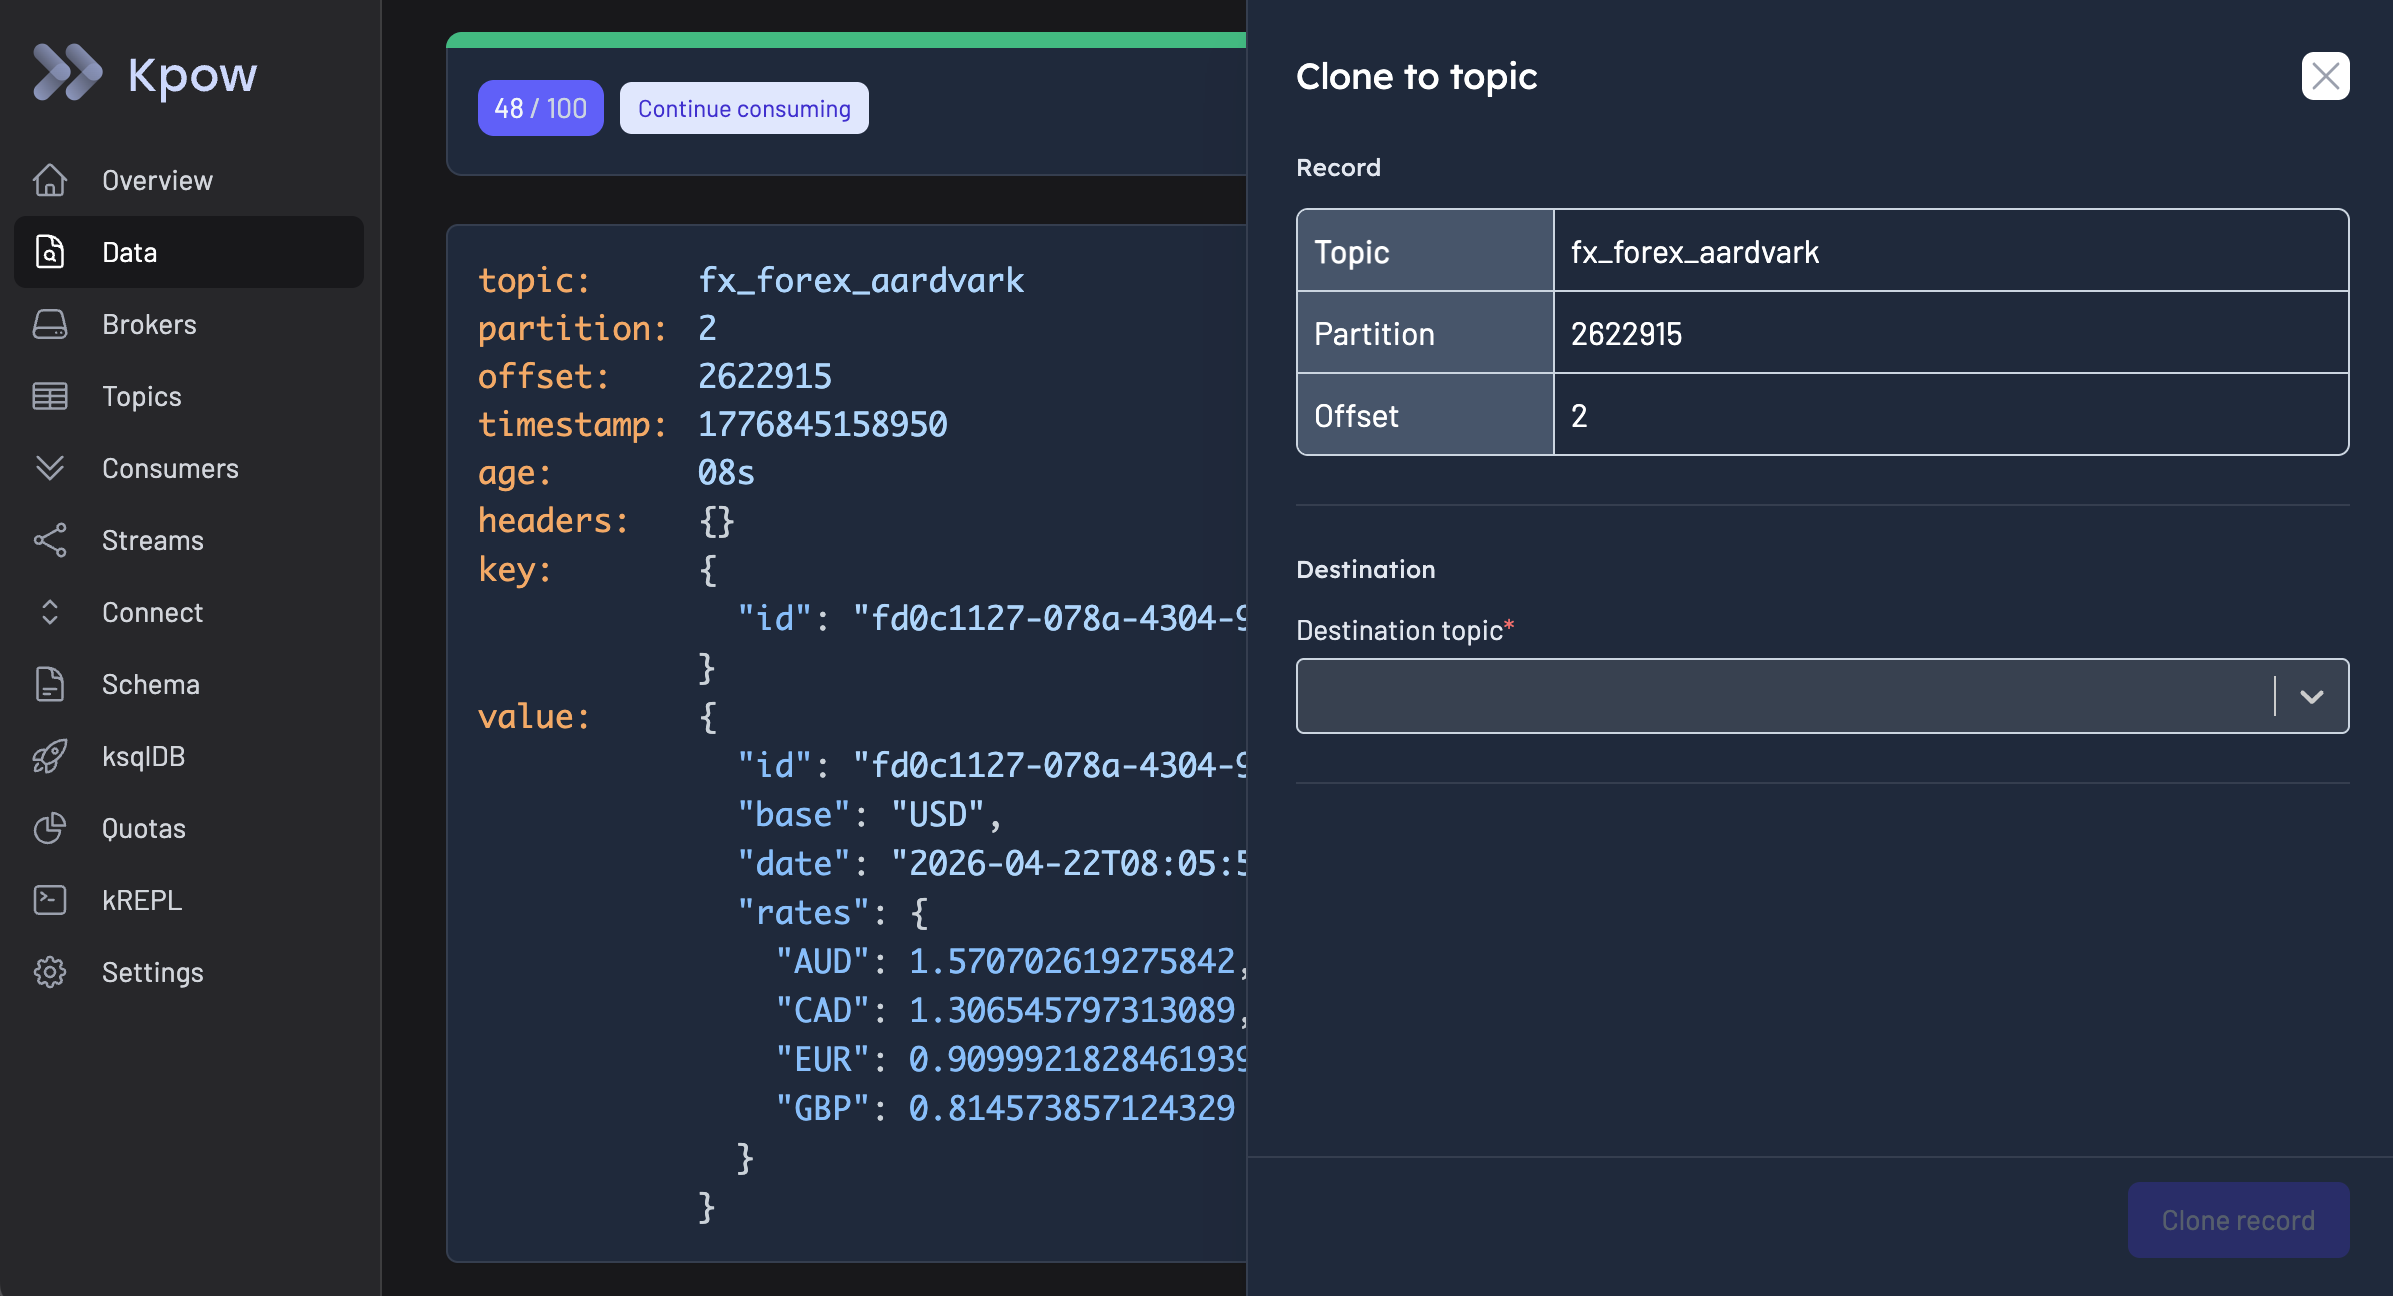
Then select a destination topic for the clone and proceed with Clone record to submit the form:
To restrict the set topics that can be cloned from- or to, you can use
RBAC actions TOPIC_CLONE_SOURCE and TOPIC_CLONE_SINK, e.g.,
policies:
  - actions: [ "TOPIC_CLONE_SOURCE" ]
    effect: Allow
    resource: [ "cluster", "*", "topic", "*.*.dlq" ]
    roles: [ "kafka-users" ]
  - actions: [ "TOPIC_CLONE_SINK" ]
    effect: Allow
    resource: [ "cluster", "*", "topic", "*.*.retry" ]
    roles: [ "kafka-users" ]
Or simply use the TOPIC_CLONE action if separate from- and to- topic
restrictions aren't required.
Configuration
The underlying data inspect engine is configurable. See the environment variable reference for a full list of configuration options. All environment variables prefixed with SAMPLER_ control the data inspect engine.
Worker configuration
Data inspect queries are executed within a worker queue. When a request comes in, Kpow assigns it to an available worker, which either executes the query immediately in its own thread or holds it until capacity frees up.
If the queues buffer is at capacity (default=1000) the request will be rejected and the user will see a "Rejected" state for their query and will have to retry.
By default, Kpow runs a single worker, meaning only one data inspect query can execute concurrently. Other users will see a "Queued" state for their queries until the worker is free. This is usually fine at scale — queries complete quickly once the result limit (the first of SAMPLER_TIMEOUT_MS or 100 consumed records) is reached — but can become a bottleneck when multiple users are active and long-running or low-cardinality queries monopolize the worker.
You can increase the number of concurrent workers using the SAMPLER_N_WORKERS environment variable. The right value depends on the number of users running data inspect queries and the types of queries they typically run. Bear in mind that each worker maintains its own consumer thread pool (default: 3 threads), so increasing workers will proportionally increase both Kpow's resource usage and the number of concurrent consumers reading from your Kafka brokers — worth considering if your cluster is already under significant load.
Query configuration
A number of environment variables control the performance of individual data inspect queries. The defaults should be suitable for most installations.
-
SAMPLER_N_CONSUMERS— Kpow creates a consumer connection pool for each worker when executing data inspect queries. This variable controls how many consumer threads each worker has available (default: 3). Increasing this value improves query throughput by allowing more consumers to scan for records in parallel. -
SAMPLER_TIMEOUT_MS— a query will stop once it has found the limit of positively matched records (100) or after a timeout (default: 7s). You can always pick up where a query left off by clicking "Continue Consuming", or run the query as a streaming search. -
SAMPLER_POLL_MS— the poll duration used by data inspect consumers (default: 3500ms). For most deployments the default is fine, but if your topics contain large messages you may see performance improvements by increasing this value, as consumers have more time to fetch and batch records per poll.
SerDes
Custom SerDes + SerDes configuration
See the SerDes section for details on how to configure custom SerDes, integrate schema registry and more for data inspect.
TOPIC_INSPECT authorization
To enable inspection of key/value/header contents of records, set the ALLOW_TOPIC_INSPECT environment variable to true. If you are using role-based access control, view our guide here.
Data policies/redaction
To configure data policies (configurable redaction of Data inspection results) view our Data Policies.
Snappy compression
Snappy compression requires a writable temporary directory. When deploying Kpow as an immutable container with a read-only filesystem, you'll need to configure an ephemeral volume mount.
Helm charts
We provide an ephemeralTmp attribute for Snappy compression in read-only filesystems. It is disabled by default and can be enabled - modify the volume configuration if necessary:
ephemeralTmp:
  enabled: true
  volume:
    emptyDir:
      medium: Memory # Optional: for better performance
      sizeLimit: "100Mi" # Configurable size
Learn more at Kpow's Helm charts documentation
Docker deployments
To have Snappy compression work with immutable Docker deployments outside Kubernetes, ensure that your container has a read–write volume mounted at:
/opt/factorhouse/tmp
To guarantee this, bind-mount a host directory or a named volume into /opt/factorhouse/tmp.
Docker Compose
version: "3.9"

services:
  kpow:
    image: factorhouse/kpow:latest
    read_only: true
    volumes:
      - factorhouse_tmp:/opt/factorhouse/tmp

volumes:
  factorhouse_tmp:
    driver: local
ECS/Fargate
      "readonlyRootFilesystem": true,
      "mountPoints": [
        {
          "sourceVolume": "factorhouse-tmp",
          "containerPath": "/opt/factorhouse/tmp",
          "readOnly": false
        }
      ],