Job manager
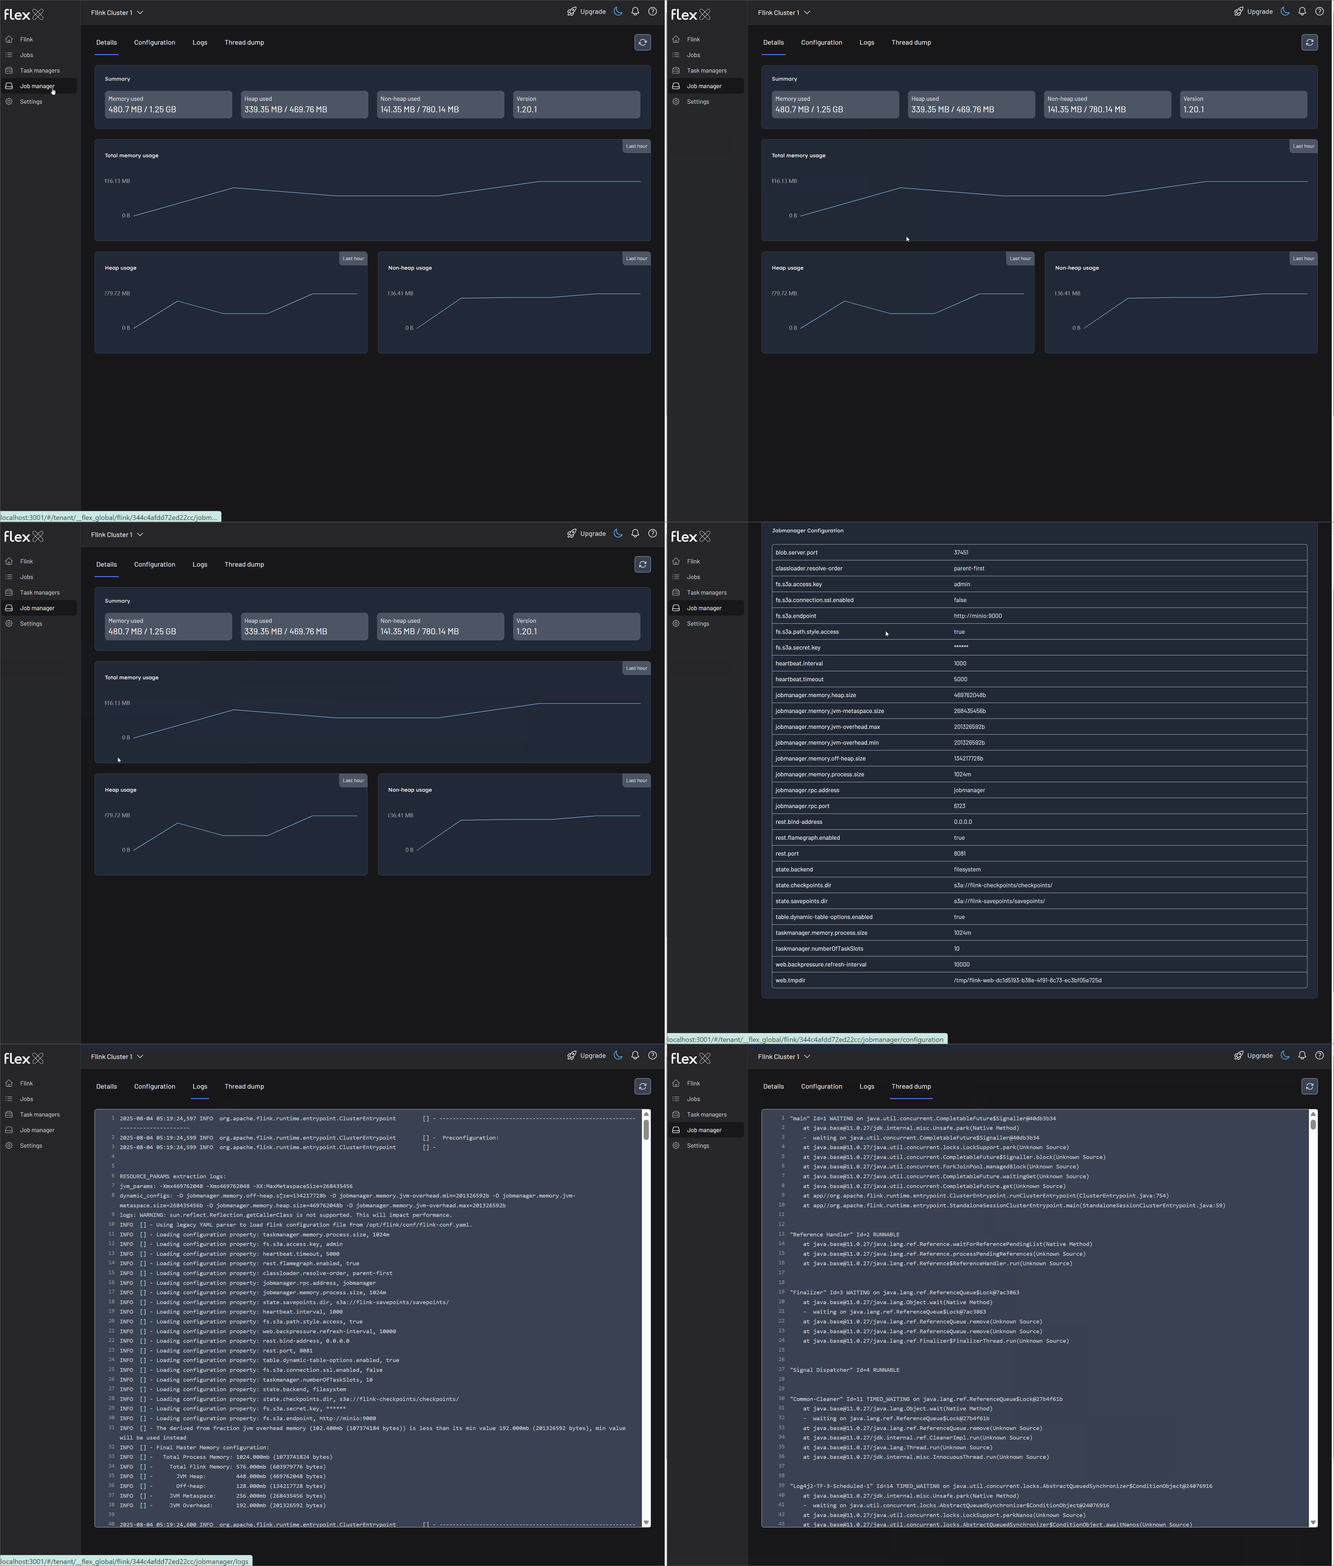
The Job Manager is the central coordinating process of an Apache Flink cluster. It is responsible for scheduling jobs, managing checkpoints, and coordinating recovery on failure. The Job manager view in Flex provides critical insights into the health, resource consumption, and configuration of this core component.

Details
The Details tab serves as the main dashboard for monitoring the Job Manager's real-time status and performance.
Summary Statistics
A series of cards at the top of the page displays vital, at-a-glance information:
- Memory used: The total memory consumed by the Job Manager's JVM process (e.g.,
592.86 MB / 1.25 GB). - Heap used: The portion of memory used by the Java heap, where application objects are stored (e.g.,
350.05 MB / 469.76 MB). - Non-heap used: The memory used outside the heap, including Metaspace and other JVM overhead (e.g.,
242.81 MB / 780.14 MB). - Version: The Apache Flink version the Job Manager is running, which is crucial for ensuring compatibility (e.g.,
1.20.1).
Performance Graphs
These line graphs offer a historical perspective of memory utilization over the past hour, making it easy to spot trends, identify potential memory leaks, and ensure the Job Manager is provisioned correctly.
- Total memory usage: Tracks the overall memory footprint of the Job Manager process.
- Heap usage: Visualizes the consumption of Java heap memory.
- Non-heap usage: Visualizes the consumption of off-heap memory.
Configuration
This section displays the static configuration that the Job Manager was started with. This information is read-only and is essential for verifying that the cluster is running with the intended settings.
JobManager Configuration
| Key | Value |
|---|---|
jobmanager.memory.heap.size | 469762048b |
jobmanager.memory.jvm-metaspace.size | 268435456b |
jobmanager.memory.jvm-overhead.max | 201326592b |
jobmanager.memory.jvm-overhead.min | 201326592b |
jobmanager.memory.off-heap.size | 134217728b |
jobmanager.memory.process.size | 1024m |
jobmanager.rpc.address | jobmanager |
jobmanager.rpc.port | 6123 |
rest.bind-address | 0.0.0.0 |
Logs
This tab provides direct, real-time access to the Job Manager's log files. Presented in a familiar view similar to the Flink Web UI, it is the primary tool for troubleshooting cluster-level events, such as job submission failures, checkpointing issues, or high-availability service problems. You can use it to view live log output, or search for specific messages.
Thread dump
This tab allows you to request and view a live thread dump from the Job Manager's JVM. A thread dump provides a snapshot of the state of all threads, making it an indispensable tool for diagnosing complex issues like deadlocks, performance bottlenecks, or an unresponsive Job Manager. The interface is consistent with the Flink Web UI, allowing for easy navigation and analysis of thread states.