Flex management overview
Flex provides a real-time snapshot of the Flink cluster's vital signs in Overview. It is divided into sections covering task managers, job statistics, data throughput, and detailed job states.
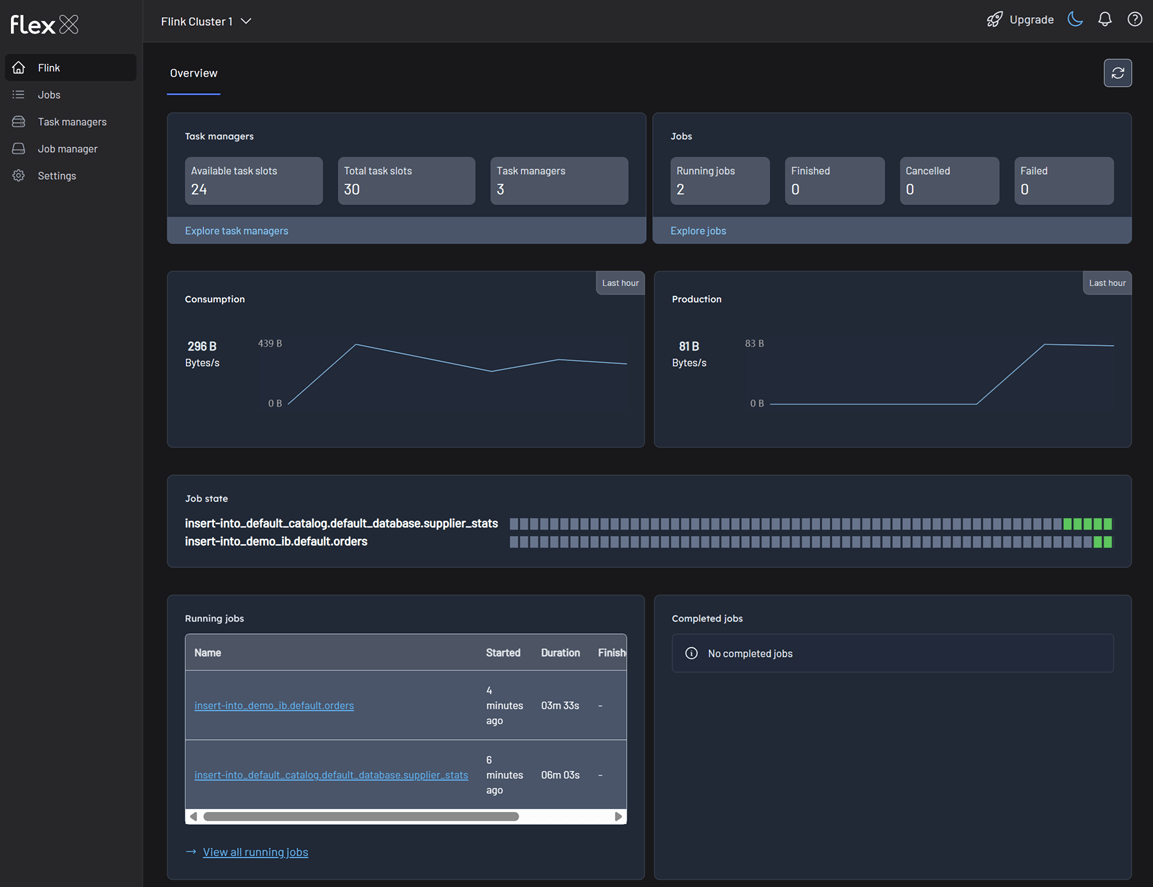
Task managers
Task managers are the worker nodes in a Flink cluster, responsible for executing the tasks of a job. Monitoring their status is crucial for ensuring the cluster has enough resources to process your data streams. This section provides the following key metrics:
- Available task slots: The number of processing slots currently available to accept new tasks.
- Total task slots: The total number of processing slots available in the cluster.
- Task managers: The total number of task managers currently registered with the cluster.
A healthy cluster should have a sufficient number of available task slots to accommodate the parallelism of your jobs. A lack of available slots can lead to delays in job execution.
Jobs
This section provides a high-level overview of the status of all jobs that have been submitted to the Flink cluster. This information is critical for understanding the overall workload and identifying any widespread issues.
Flex provides the following summary of job states:
- Running Jobs: The number of jobs currently in the
RUNNINGstate. - Finished Jobs: The number of jobs that have successfully completed and are in the
FINISHEDstate. - Cancelled Jobs: The number of jobs that have been manually canceled and are in the
CANCELEDstate. - Failed jobs: The number of jobs that have terminated due to an error and are in the
FAILEDstate.
An increasing number of failed or cancelled jobs requires immediate investigation to identify the root cause.
Data consumption and production
Monitoring data throughput in your Flink jobs is crucial for understanding the volume of data being processed and for detecting potential bottlenecks or anomalies in the data flow. Line graphs showing the total change in bytes read and written over the past hour offer a clear and intuitive way to visualize and track these metrics.
- Total change in the number of bytes read by Flink jobs in the cluster: This line graph will show the rate at which data is being ingested into the Flink cluster from its sources.
- Production: The total change in the number of bytes written by Flink jobs in the cluster. This line graph will illustrate the rate at which processed data is being written to the sinks.
Sudden spikes or drops in these graphs can indicate issues with upstream data producers or downstream data consumers, or they could reflect changes in the workload.
Job state
Understanding the specific state of each job is fundamental to managing your Flink cluster effectively. Each job progresses through a series of states during its lifecycle. For each job, the "state" field will indicate one of the following values:
- RUNNING (green square): The job is currently executing
- FINISHED: The job has completed successfully.
- CANCELLED: The job was manually stopped.
- FAILED: The job terminated with an error.
Running and completed jobs
For more granular insight into your cluster's operations, we provide separate tables for running and completed jobs. This allows for a quick assessment of ongoing processes and a historical view of job executions. Flex provides a list of all jobs with their respective details.