Jobs
The Jobs section is the central hub for managing and inspecting Flink applications.
Manage jobs
Flex supports uploading a packaged application JAR file. A Flink job can be submitted from this JAR, or the file can be deleted if it's no longer needed.
Upload JAR
To get started, upload a packaged application JAR file by clicking the Upload JAR button in the JARs tab. This action will open your local file explorer, allowing you to select and upload the desired JAR file to the Flink cluster. Once uploaded, the JAR will appear in the list.
Each uploaded JAR is listed with a corresponding Actions menu (▤) that provides management options. This menu supports either submitting the JAR as a new job or deleting the JAR file permanently.
Submit a JAR file
Click the Submit button from the Actions menu (▤) to launch a new job. A configuration form will appear from the right, allowing you to specify execution parameters. These settings are optional and can be used to override or provide parameters that are not already specified in your application.
- Entry Class - The fully qualified name of your application's main class (e.g.,
org.example.MyStreamingJob). This is the entry point that Flink will execute. - Parallelism - The default number of parallel instances for each task in the job. This setting determines the level of concurrency.
- Arguments - Any command-line arguments your application needs to run, provided as a space-separated list.
- Savepoint Path - The path to a savepoint file. Specifying a path allows the job to resume its state from a previous execution, which is crucial for updates and recovery.
- Claim mode - Defines how the cluster interacts with the specified savepoint.
- CLAIM: The job takes ownership of the savepoint, meaning it may be consumed or moved.
- NO_CLAIM: The job uses the savepoint without taking ownership, leaving it available for other jobs to use.
- LEGACY: For restoring from savepoints created with older Flink versions.
- Restore mode - Specifies how the state from the savepoint should be restored.
- CLAIM: The job restores its state from the savepoint.
- NO_CLAIM: The job does not restore state from the savepoint.
- LEGACY: Used for compatibility with legacy savepoint formats.
- Allow Non Restored State - (Checkbox) Check this box to allow the job to start even if some state from the savepoint cannot be mapped to the new job graph. This is useful when the job logic has changed.
After configuring these parameters, click the Submit button at the bottom of the form to launch the job.
Delete a JAR file
To remove an uploaded JAR file from the environment, select Delete from the hamburger menu. A confirmation prompt will appear to ensure the action is intentional. Confirming will permanently remove the JAR file from the Flink cluster.
Inspect jobs
Flex offers comprehensive insights for monitoring, analyzing, and debugging Flink jobs through its Overview, Details, and Inspect tabs.
Overview
The Overview tab provides a high-level, aggregated dashboard for all jobs running on the cluster. It is ideal for getting a quick snapshot of the cluster's health and throughput. You can view metrics for all jobs or use the filter to narrow down the selection.
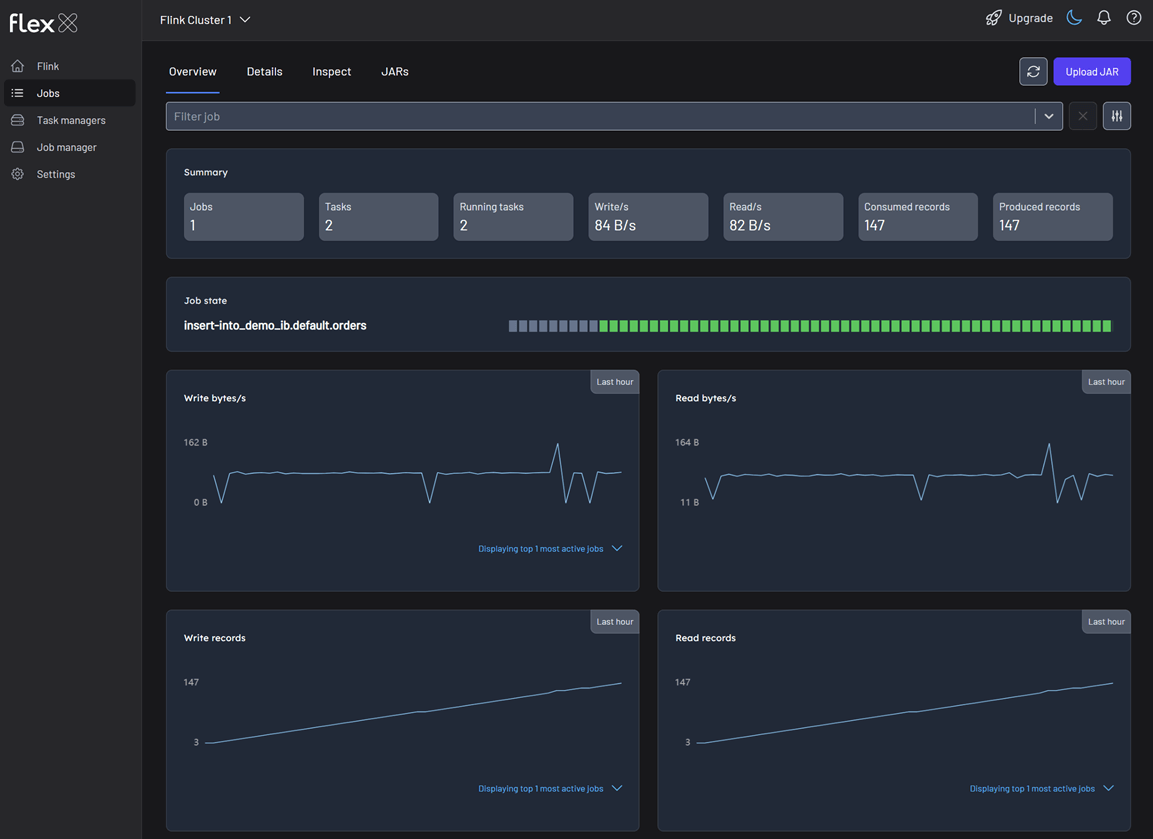
Summary statistics
Cards at the top display key real-time metrics for the selected jobs:
- Jobs: The total number of jobs included in the view.
- Tasks: The total number of tasks across all selected jobs.
- Running tasks: The number of tasks currently in the
RUNNINGstate. - Writes/s: The current rate of bytes being written per second.
- Reads/s: The current rate of bytes being read per second.
- Consumed records: The total number of records consumed by source tasks.
- Produced records: The total number of records produced by sink tasks.
Job state
Understanding the specific state of each job is fundamental to managing your Flink cluster effectively. Each job progresses through a series of states during its lifecycle. For each job, the "state" field will indicate one of the following values:
- RUNNING: The job is currently executing.
- FINISHED: The job has completed successfully.
- CANCELLED: The job was manually stopped.
- FAILED: The job terminated with an error.
Performance graphs
This section features line graphs that show changes in various metrics over the past hour, helping you identify trends and spot anomalies. Each chart also includes quick filters to highlight the most or least active jobs, the largest or smallest jobs, or a custom selection.
- Total change in the number of bytes written/read: The rate of data throughput (bytes per second).
- Total number of records written/read: The rate of records processed (records per second).
- Write/Read bytes total: Total number of bytes written/read. The cumulative volume of data processed over time.
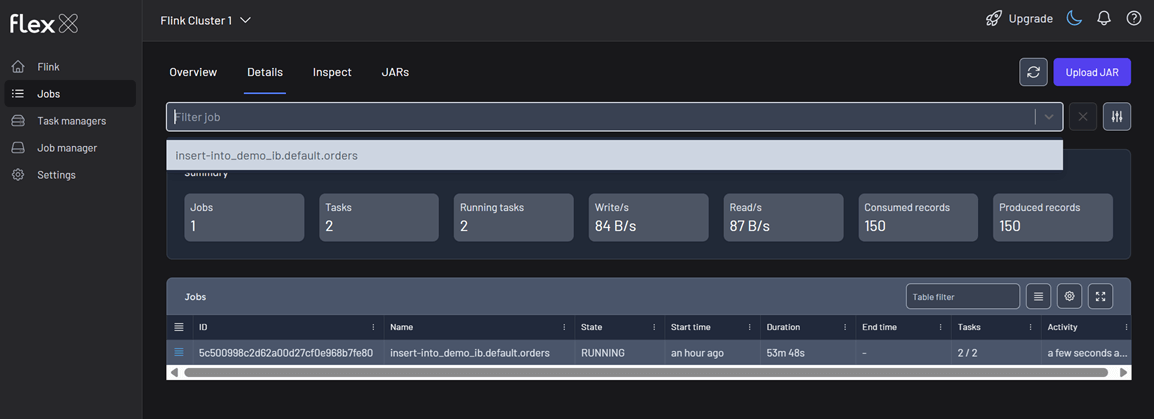
Details
The view shows summary statistics of all jobs, or you can apply filters to focus on specific jobs for more targeted monitoring.
Below that, a detailed table lists all jobs—or just the ones you've filtered—with the following information:
- Actions (▤): …
- ID: The unique identifier for the job.
- Name: The user-defined name of the job.
- State: The current lifecycle state (e.g.,
RUNNING,FAILED). - Start time: When the job was started, displayed as a relative time (e.g., 2 hours ago).
- Duration: The total runtime of the job in
DDd HHh MMm SSsformat. - End time: The time the job finished, if applicable.
- Tasks: The number of tasks in the job.
- Activity: The time of the last recorded event for the job, indicating its recent activity (e.g., a few seconds ago).
Inspect
The Inspect tab enables deep-dive analysis of a specific Flink job. To get started, select a job from the Filter job dropdown at the top of the page. This view is organized into several tabs for detailed investigation: Overview, Topology, Events, Configuration, and Checkpoints.
You can also perform quick actions on the selected job using the following buttons: Stop, Cancel, Savepoint, and Checkpoint.
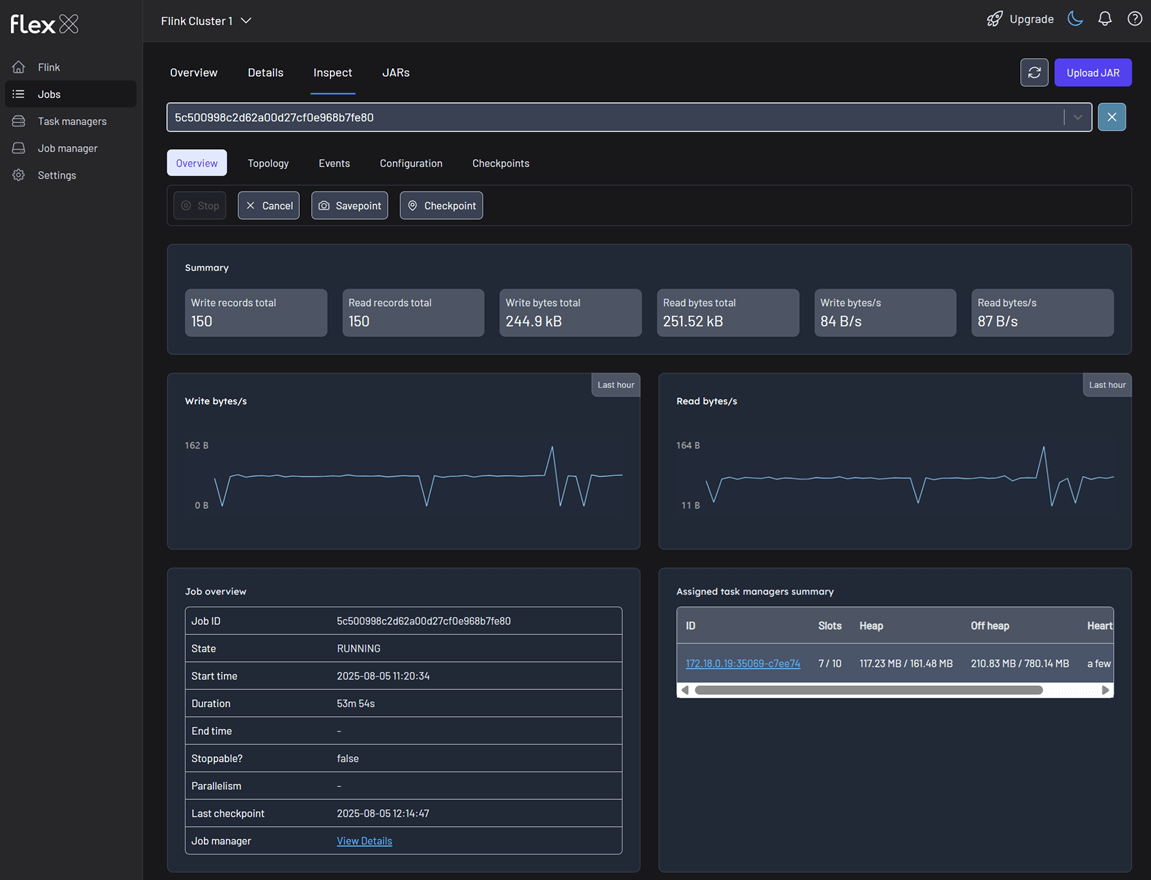
Overview
This is the main dashboard for the selected job, summarizing its performance and status.
Summary statistics
- Write/Read records total: The total number of records written and read by the job.
- Write/Read bytes total: The total volume of bytes written and read by the job.
- Write/Read bytes/s: The current data throughput rate for the job.
Line graphs
- Total change in the number of bytes written by the Flink job: Visualizes the output data rate over the past hour.
- Read bytes/s: Total change in the number of bytes read by the Flink job. Visualizes the input data rate over the past hour.
Job overview table
A detailed summary of the job's core attributes.
- Job ID: The unique identifier.
- State: The current lifecycle state.
- Start/End time: The exact timestamps for the job's execution.
- Duration: The total runtime.
- Stoppable?: A boolean (
true/false) indicating if the job can be gracefully stopped via a savepoint. - Parallelism: The parallelism level set for the job.
- Last checkpoint: Information about the most recent checkpoint.
- Job manager: A link to the JobManager instance overseeing this job.
Assigned task managers summary
A list of all TaskManagers currently executing tasks for this job.
- ID: The unique identifier of the TaskManager, which also serves as a link to its details.
- Slots: The number of task slots on this TaskManager, showing both allocated and available slots.
- Heap/Off heap: The memory resources used by the TaskManager.
- Heartbeat: The last time a heartbeat was received, indicating its health.
Topology
This tab displays the job's dataflow graph, visually representing the operators (tasks) and the data streams connecting them. This is identical to the Flink Job Graph and is crucial for understanding the application's structure and identifying performance bottlenecks.
For each task selected in the graph, you can inspect the following details:
- Overview: Basic information like State, Parallelism, and Duration for the specific task.
- Metrics:
- Subtask metrics: Detailed metrics for each parallel instance of the task (e.g.,
Bytes received,Records sent). - Aggregated metrics: Statistical aggregations (Min, Max, Avg, Sum, percentiles) of key performance metrics like
read-bytesandread-recordsacross all subtasks.
- Subtask metrics: Detailed metrics for each parallel instance of the task (e.g.,
- Taskmanagers: A list of hosts where the task's parallel instances are running.
- Watermarks: The current watermark value for each subtask, essential for debugging event-time processing logic.
- Accumulators: A view of any user-defined accumulators used for custom metrics.
- Backpressures: Provides insight into data flow issues.
- Status:
OK,LOW,HIGH. - Backpressure level: A percentage indicating the severity of the backpressure.
- Status:
Events
This tab provides a reverse-chronological log of significant lifecycle events for the job. It is invaluable for debugging failures and understanding the job's execution history. Here's an example:
| Time | Date | Event |
|---|---|---|
| 03m 04s | 2025-08-04 17:48:20 | Triggered CHECKPOINT 96 with status IN_PROGRESS |
| 04m 06s | 2025-08-04 17:47:18 | Triggered CHECKPOINT 95 with status COMPLETED |
| 08m 01s | 2025-08-04 17:43:23 | Flink job entered state RUNNING |
| 09m 04s | 2025-08-04 17:42:20 | Flink job entered state RESTARTING |
| 09m 54s | 2025-08-04 17:41:30 | Triggered CHECKPOINT 91 with status FAILED |
Configuration
This tab displays the configuration settings that were used to submit the job.
- Job execution config: System-level configurations.
execution-mode: e.g.,PIPELINED.restart-strategy: e.g.,Cluster level default restart strategy.job-parallelism: e.g.,3.object-reuse-mode: e.g.,false.
- User config: A key-value map of all user-provided configuration values.
Checkpoints
This tab provides detailed information about the job's checkpointing mechanism, which is critical for fault tolerance and state recovery.
Summary statistics
- Triggered, Completed, In progress, Restored, Failed: A count of checkpoints by status.
- Avg checkpoint size: The average size of a completed checkpoint.
- Avg duration: The average time taken to complete a checkpoint.
History table
A detailed log of all checkpoint attempts.
- ID: The checkpoint ID.
- Type: The type of checkpoint (e.g., CHECKPOINT).
- Status:
COMPLETED,IN_PROGRESS, orFAILED. - Savepoint?: A check (✓) or cross (✗) indicating if it was triggered as a savepoint.
- Triggered: When the checkpoint was initiated.
- Duration: The time it took to complete.
- Size: The size of the checkpointed state.
Configuration
Displays the detailed configuration of the job's state backend and checkpointing behavior. Here's an example:
| Configuration | Value |
|---|---|
externalization | {:enabled false, :delete_on_cancellation true} |
checkpoint_storage | FileSystemCheckpointStorage |
mode | exactly_once |
max_concurrent | 1 |
state_backend | HashMapStateBackend |
min_pause | 30000 |
interval | 60000 |
timeout | 120000 |