Task managers
Task Managers (TaskNodes) are the worker nodes in a Flink cluster. They are responsible for executing the tasks that make up a job. The Task managers view in Flex is your central dashboard for monitoring the health, availability, and resource utilization of these critical components.

Details
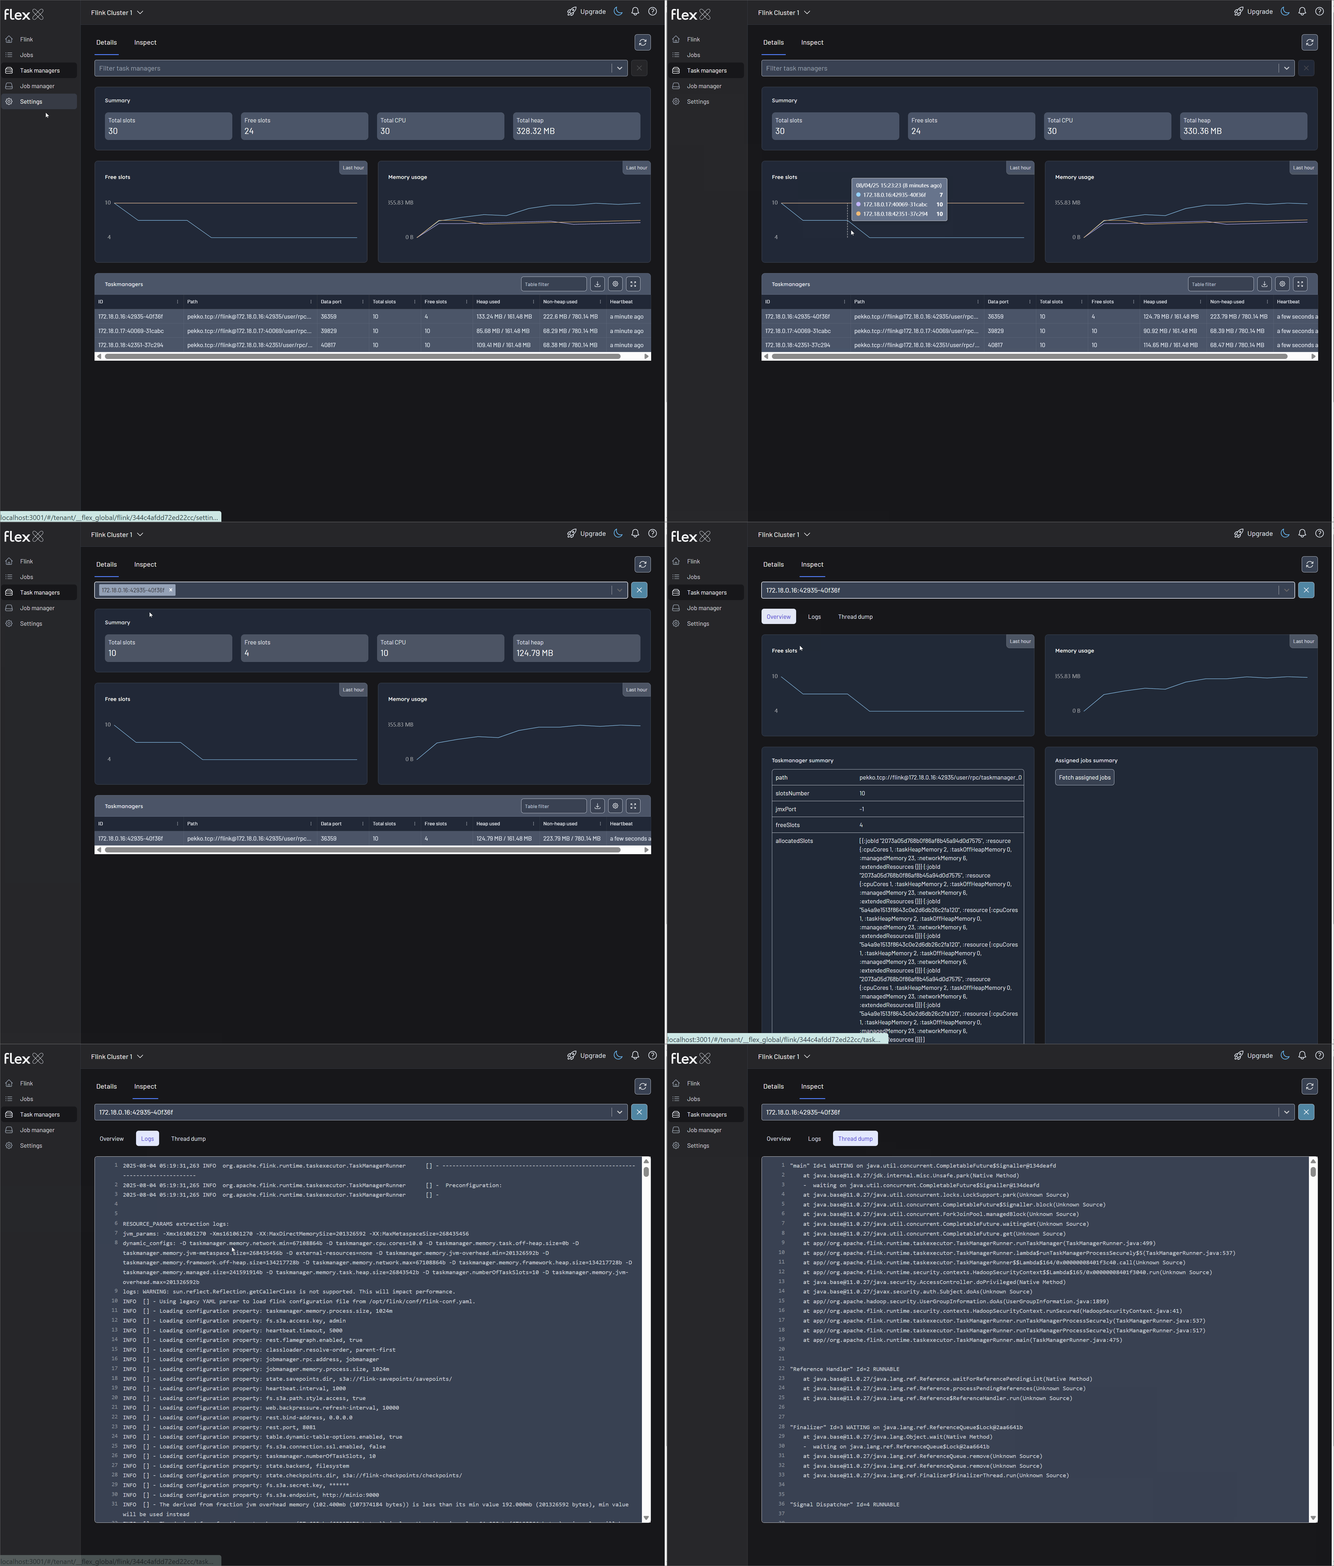
The Details tab provides a comprehensive overview of all task managers currently registered with the cluster. You can view the entire set or use the filter bar at the top to search for one or more specific managers.
Summary statistics
A set of cards at the top of the page displays aggregated, real-time statistics for the entire cluster:
- Total slots: The total number of processing slots available across all task managers.
- Free slots: The number of slots that are currently available to accept new tasks.
- Total CPU: The combined CPU capacity of all task managers.
- Total heap: The total configured heap memory across all task managers.
Performance graphs
Line graphs provide a historical view of resource utilization over the past hour, helping you spot trends or anomalies at the cluster level.
- Free slots: Tracks the availability of processing slots over time.
- Memory usage: Visualizes the total memory consumption across the cluster.
Task managers table
A detailed table lists each task manager and its key metrics, allowing for easy comparison and health checks.
| ID | Path | Data port | Total slots | Free slots | Heap used | Non-heap used | Heartbeat |
|---|---|---|---|---|---|---|---|
172.18.0.16:39193-cfb720 | pekko.tcp://.../taskmanager_0 | 39193 | 10 | 7 | 114.46 MB / 161.48 MB | 212.06 MB / 780.14 MB | A few seconds ago |
- ID: The unique identifier of the task manager, typically including its IP address and a random hash.
- Path: The internal Akka path used for RPC communication.
- Data port: The port used for data transfer between task managers.
- Total slots/Free slots: The capacity and current availability of task slots on the manager.
- Heap used/Non-heap used: The amount of Java heap and off-heap memory currently in use versus the total allocated.
- Heartbeat: The last time a heartbeat was received, indicating the manager is alive and connected.
Inspect
To perform a deep-dive analysis of a single worker node, select a task manager in the Inspect tab, which provides detailed diagnostics for that specific manager.
Overview
This is the main dashboard for the selected task manager.
Performance graphs
Line graphs provide a focused view of resource trends for just this task manager over the past hour.
- Free slots: Tracks the availability of processing slots on this specific manager.
- Memory usage: Visualizes the memory consumption trends for this manager.
TaskManager summary
A detailed summary table displays the static and dynamic properties of the selected task manager.
| Property | Value |
|---|---|
path | pekko.tcp://flink@172.18.0.19:35069/user/rpc/taskmanager_0 |
slotsNumber | 10 |
jmxPort | -1 |
freeSlots | 7 |
allocatedSlots | A detailed list of slots that are currently assigned to jobs, including the jobId and the specific resources (cpuCores, taskHeapMemory, etc.) allocated to each slot. |
id | 172.18.0.19:35069-c7ee74 |
timeSinceLastHeartbeat | 1754360484554 |
dataPort | 40815 |
Logs
This tab provides direct access to the live log files of the task manager. The interface is designed to be familiar to users of the Flink Web UI, allowing you to view real-time log output, or search for specific entries. This is an essential tool for debugging task-level errors and performance issues.
Thread dump
This tab allows you to generate and view a thread dump from the task manager's Java Virtual Machine (JVM). A thread dump captures the state of all threads at a specific moment in time and is invaluable for diagnosing issues like deadlocks, high CPU usage, or unresponsive tasks. The presentation is similar to the thread dump view in the Flink Web UI, making it easy to navigate and analyze.